
Ever wondered how the cool nerds keep tabs on their applications without breaking the bank? Well, you’re in luck, because we’re about to dive into the world of self-hosted monitoring awesomeness. In this guide, we’ll walk you through setting up a monitoring stack that would make even the most seasoned DevOps engineer nod in approval. Best part? It’s all running in Docker containers, so you can spin it up faster than you can say “Is the server on fire?”
The Monitoring Dream Team
Before we dive into the setup process, let’s introduce the key components of our monitoring stack:
- Grafana: The visualization layer of our monitoring stack. It transforms raw data into informative dashboards and graphs, providing clear insights into system performance.
- Prometheus: Our metrics collection system. It gathers and stores time-series data from various sources, enabling us to track system and application metrics over time.
- CAdvisor: A container-aware performance monitoring tool. It collects detailed resource usage and performance data from running Docker containers.
- Loki: A log aggregation system designed for high-volume log processing. It efficiently gathers and indexes logs from various sources within your infrastructure.
- Promtail: The log collection agent for Loki. It’s responsible for discovering log files, tagging them with appropriate metadata, and forwarding them to Loki for storage and analysis.
With these powerful tools working together, we can create a comprehensive monitoring solution that covers metrics, logs, and visualization. Now, let’s proceed to the setup process.
Some Examples
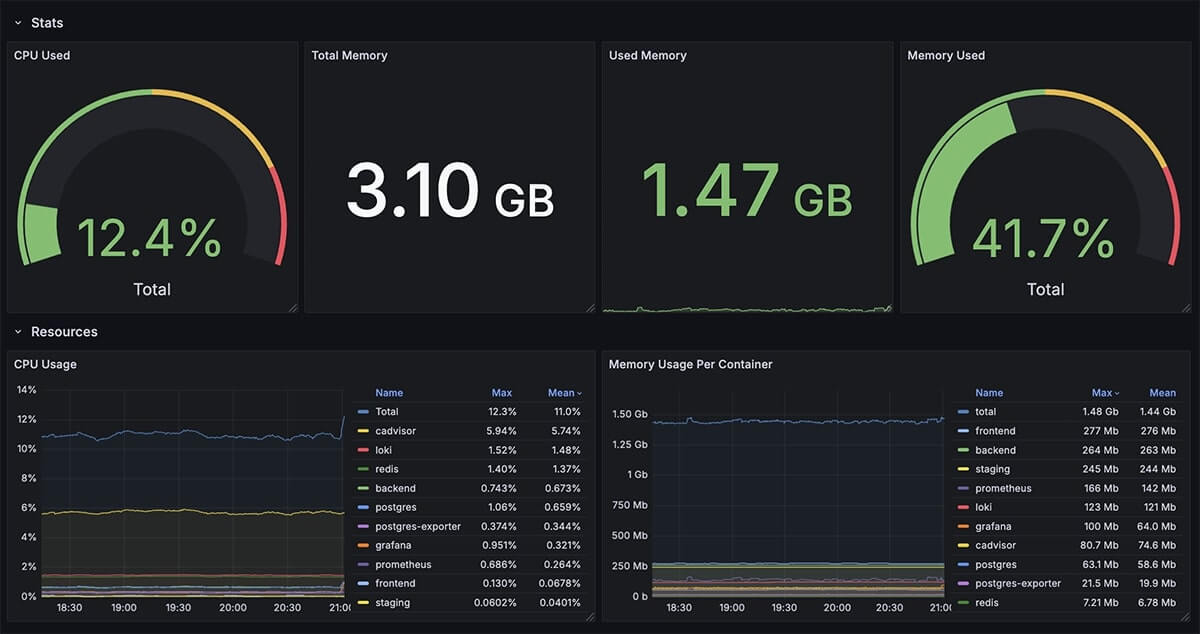
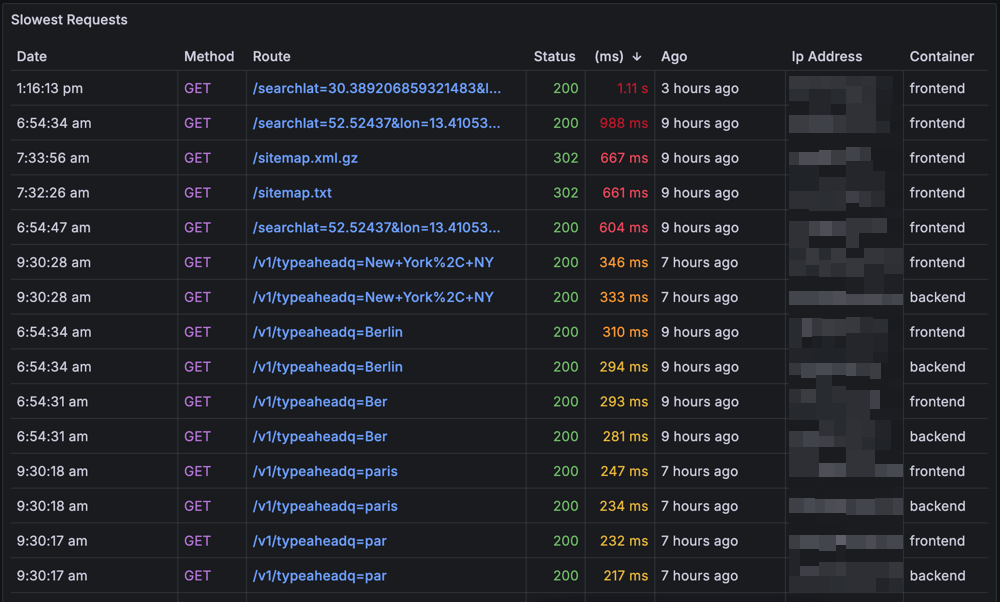
Here’s some examples of what you can do with this stack. These are all screenshots from our monitoring dashboards.
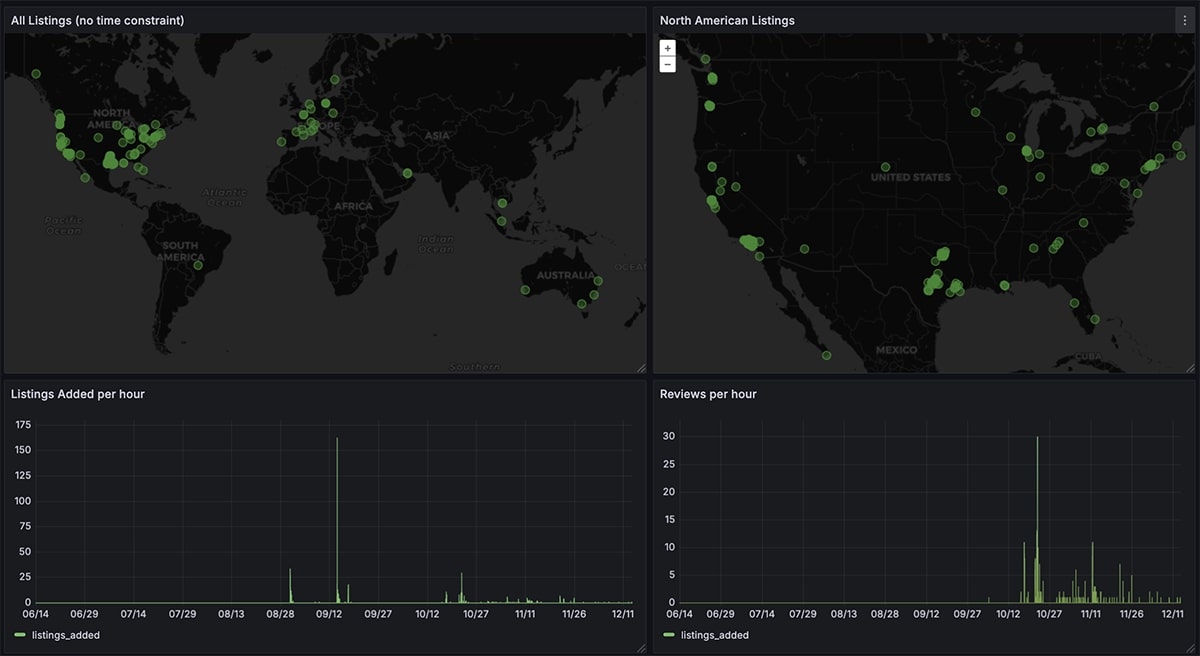
* Grafana Listings dashboard reading from the main application Postgres database

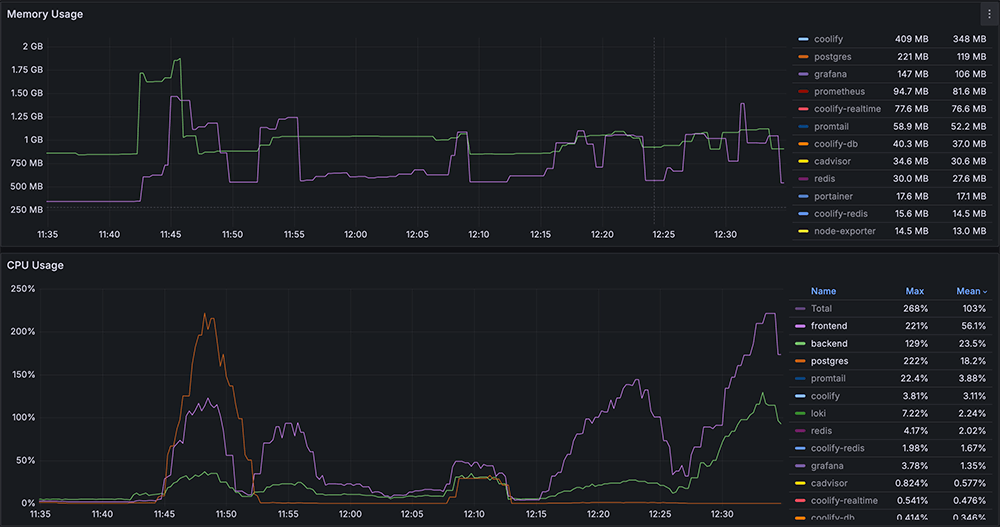
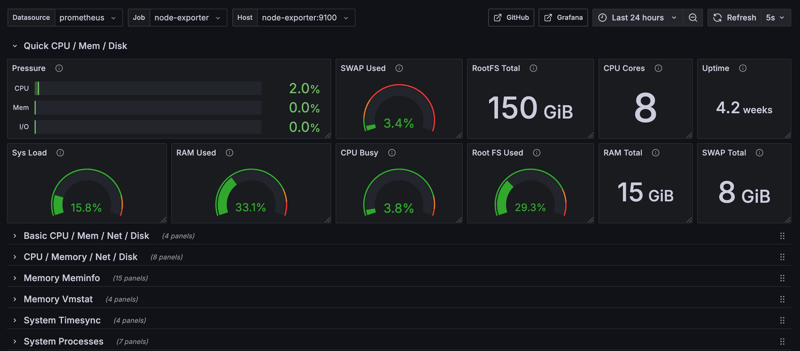
* Grafana X Node Exporter dashboard
Prerequisites
System Requirements
- A machine capable of running Docker and Docker Compose
- At least 2GB of available RAM
- 10GB+ of free disk space
- CPU: 2+ cores recommended
Technical Knowledge
- Basic understanding of Docker and container concepts
- Familiarity with YAML configuration files
- Basic command-line experience
- Understanding of basic monitoring concepts (metrics, logs)
Setting Up the Monitoring Stack
Step 1: Create a Docker Compose File
First things first, we need to create a docker-compose.yml file.
services:
  grafana:
    image: grafana/grafana:latest
    platform: linux/arm64
    ports:
      - "3000:3000"
    volumes:
      - grafana-storage:/var/lib/grafana

  prometheus:
    image: prom/prometheus:latest
    platform: linux/arm64
    ports:
      - "9090:9090"
    volumes:
      - ./prometheus.yml:/etc/prometheus/prometheus.yml
      - prometheus-data:/prometheus

  cadvisor:
    image: gcr.io/cadvisor/cadvisor:latest
    platform: linux/arm64
    ports:
      - "8080:8080"
    volumes:
      - /:/rootfs:ro
      - /var/run:/var/run:ro
      - /sys:/sys:ro
      - /var/lib/docker/:/var/lib/docker:ro

  loki:
    image: grafana/loki:latest
    platform: linux/arm64
    ports:
      - "3100:3100"
    volumes:
      - ./loki-config.yaml:/etc/loki/loki-config.yaml
      - ./volumes/loki:/var/lib/loki
      - loki_data:/loki
    command: -config.file=/etc/loki/loki-config.yaml

  promtail:
    image: grafana/promtail:latest
    platform: linux/arm64
    volumes:
      - /var/log:/var/log
    command: -config.file=/etc/promtail/config.yml

volumes:
  grafana-storage:
  prometheus-data:
Step 2: Configure Prometheus
Create a prometheus.yml file in the same directory as your docker-compose.yml:
global:
  scrape_interval: 15s

scrape_configs:
  - job_name: 'prometheus'
    static_configs:
      - targets: ['localhost:9090']

  - job_name: 'cadvisor'
    static_configs:
      - targets: ['cadvisor:8080']
Step 3: Configure Promtail
Create a promtail-config.yml file:
server:
  http_listen_port: 9080
  grpc_listen_port: 0

positions:
  filename: /tmp/positions.yaml

clients:
  - url: http://loki:3100/loki/api/v1/push

scrape_configs:
  - job_name: system
    static_configs:
    - targets:
        - localhost
    labels:
      job: varlogs
      __path__: /var/log/*log
Step 4: Create a Loki Configuration File
Create a loki-config.yaml file:
auth_enabled: false

server:
  http_listen_port: 3100
  grpc_listen_port: 9096

common:
  path_prefix: /loki
  storage:
    filesystem:
      chunks_directory: /loki/chunks
      rules_directory: /loki/rules
  replication_factor: 1
  ring:
    kvstore:
      store: inmemory

schema_config:
  configs:
    - from: 2020-10-24
      store: tsdb
      object_store: filesystem
      schema: v13
      index:
        prefix: index_
        period: 24h

limits_config:
  retention_period: 30d
  reject_old_samples: true
  reject_old_samples_max_age: 168h
  max_entries_limit_per_query: 5000
  allow_structured_metadata: false

ruler:
  storage:
    type: local
    local:
      directory: /loki/rules

compactor:
  working_directory: /loki/compactor
  retention_enabled: true
  retention_delete_delay: 2h
  compaction_interval: 10m
  delete_request_store: filesystem
Step 5: Fire It Up!
Now, let’s bring the system to life. From the same directory as your docker-compose.yml file, run:
docker-compose up -d
Configuring Grafana
- • Open your browser and navigate to
http://localhost:3000. - • Log in with the default credentials (
admin/admin).
Add Prometheus as a data source:
- • Go to Configuration > Data Sources > Add data source
- • Select Prometheus
- • Set the URL to
http://prometheus:9090 - • Click “Save & Test”
Add Loki as a data source:
- • Go to Configuration > Data Sources > Add data source
- • Select Loki
- • Set the URL to
http://loki:3100 - • Click “Save & Test”
Creating Your First Dashboard
Let’s create a dashboard to monitor container CPU usage:
- • Click on “Create” > “Dashboard”
- • Add a new panel
- • In the query editor, select Prometheus as the data source
- • Enter this PromQL query:
sum(rate(container_cpu_usage_seconds_total{image!=""}[1m])) by (name)
Give your panel a title like “Container CPU Usage” Save the dashboard
Viewing Logs with Loki
Create a new dashboard or add a panel to your existing one Select Loki as the data source Enter a LogQL query like:
{job="varlogs"}
You should now see your system logs in Grafana!
Conclusion
Congratulations! You’ve just set up a monitoring stack that would make most startups jealous. With Grafana, Prometheus, CAdvisor, Loki, and Promtail all playing nicely together in Docker, you’re now equipped to monitor your applications like a pro. You now have a powerful monitoring setup at your fingertips. Whether you’re tracking critical system metrics or creating fun dashboards to monitor your daily coffee consumption, the possibilities are endless. Happy monitoring!